
The Marketing Dashboard Every Small Business Should Have — And What to Leave Off
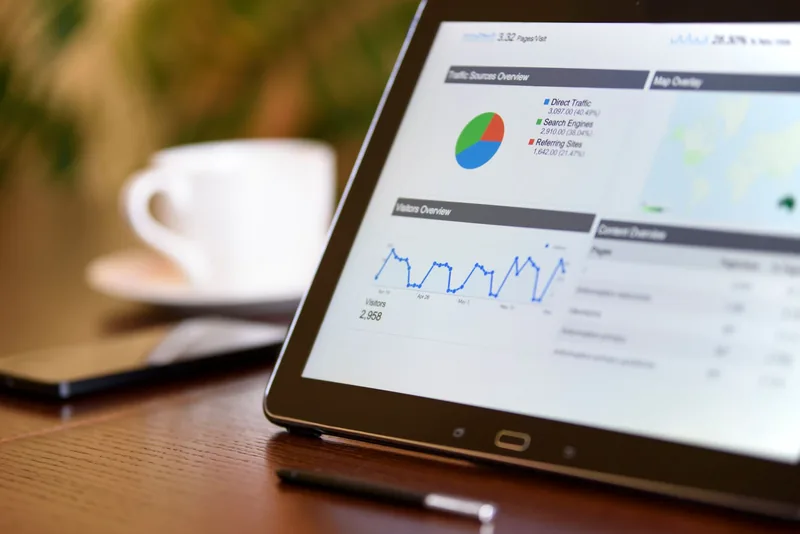
Ask most small business owners how marketing went last month and you'll get a feeling, not a number. The ad spend is in one login, the leads are in another, the website traffic is in a third, and the sales are in the POS. A marketing dashboard pulls the handful of numbers that matter onto one screen, so you can answer that question in two minutes instead of two hours. It's the piece that makes marketing analytics useful day to day instead of something you look at once a quarter.
This isn't about fancy charts. A good dashboard for a small business fits on one page, uses numbers you already have, and points at a decision. If your leads already land in one place, like the system we cover in our guide to the best CRM for small business, you're most of the way there. Here's what to put on it, what to leave off, and how to build one without hiring a data team.
What a Marketing Dashboard Actually Is
A marketing dashboard is a single report that pulls numbers from your marketing tools and shows them side by side. It updates on its own, so you're not copying figures into a spreadsheet every Monday. You open it, you see where leads came from and what they cost, and you decide what to do next.
The key word is single. Every platform already has its own reporting. Google Ads has a dashboard. Meta has one. Your email tool has one. The trouble is that each one only grades its own homework. A marketing dashboard lines them up against the same yardstick: leads, customers and money.
Why Most Small Businesses Don't Have One
It's not that owners don't care about the numbers. It's that the numbers are scattered. Leads come in through web forms, phone calls, DMs and walk-ins. Some get logged and some don't. Ad platforms report their own conversions. Nobody connects any of it to who actually paid.
So reporting becomes a monthly scramble, or it doesn't happen at all. And when the numbers aren't in front of you, budgets stay on autopilot. The ad that worked two years ago keeps getting money. The channel that quietly brings in your best customers never gets more.

The Numbers That Belong on It
Keep it short. If a number doesn't change what you'd do, it doesn't go on the dashboard. For most small businesses, these are the ones that earn a spot:
- Leads by source. Forms, calls and bookings, broken out by where they came from: Google search, Google Ads, Meta, email, referrals. This is the heart of the whole thing.
- Spend by channel. What you put into each paid channel this month.
- Cost per lead by channel. Spend divided by leads. Our guide on how to lower your cost per lead covers what to do when this number creeps up.
- Customers and revenue by source. Leads that actually bought. This is the number most dashboards skip, and the one that matters most.
- Cost per customer by channel. Spend divided by customers. A channel with cheap leads that never close is more expensive than it looks.
- Website traffic and lead rate. Visits by source and the share that turned into a lead. Useful context, but never the headline.
If you run email or SMS, add one line for it: revenue or bookings that came from your sends. That's where email and CRM automation earns its keep, and it rarely gets credit unless someone puts it on the page.
What to Leave Off
Impressions, reach, likes, followers and click-through rate all have a place inside the platforms where you manage the campaigns. They don't belong on the owner's dashboard. They move a lot, they look exciting, and they don't tell you whether the phone rang.
The same goes for every chart a tool offers by default. A dashboard with thirty charts is just a different kind of scattered. If you have to scroll, it's too long.
Where the Data Comes From
A dashboard is only as good as what feeds it. Before you build anything, make sure these four sources are in shape:
- Google Analytics 4. Website visits and leads by source. GA4's Traffic acquisition report shows where new and returning visitors come from, across organic and paid channels (Google Analytics Help). If it's not set up properly yet, start with our guide to set up GA4.
- Your ad platforms. Spend and conversions from Google Ads and Meta. Those conversions are only trustworthy if conversion tracking is set up to count real leads, not page views.
- Your phone calls. For a lot of local businesses, calls are most of the leads. If calls aren't tracked by source, your dashboard will undercount the channels that make the phone ring.
- Your CRM or POS. This is where leads become customers. Recording the lead source on every contact is what lets you report cost per customer instead of stopping at cost per lead.

How to Build One Without a Data Team
You don't need expensive software to start. Google's free reporting tool, Data Studio (it was called Looker Studio until recently), is built for exactly this. Google describes it as a no-cost tool that turns your data into "easy to read, easy to share, and fully customizable dashboards and reports" (Data Studio documentation). It has free Google-built connectors for Google Analytics, Google Ads and Google Sheets, and partner connectors for other platforms, some of which cost money (About data sources).
A simple build looks like this:
- Write the questions first. "Where did leads come from?" "What did each channel cost per customer?" Every chart has to answer one of them.
- Connect GA4 and Google Ads. These are the easiest sources and cover a lot of ground.
- Add the rest through a sheet if needed. Meta spend, call counts and closed sales can go into a Google Sheet monthly and feed the same report until you automate them.
- Lay it out top to bottom. Totals at the top (leads, customers, spend, revenue), the by-channel table under that, trends at the bottom.
- Pick one date range and stick to it. Month over month is enough for most small businesses.
Many CRMs also have a built-in reporting view. If yours shows leads and sales by source, that may be all the dashboard you need for now. Start simple and add a source only when a real question demands it.
How to Actually Use It Each Month
A dashboard nobody opens is just a nice chart. Put a 30-minute review on the calendar once a month and ask the same three questions every time:
- Which channel brought in customers at a cost we're happy with? That one gets more budget or more attention.
- Which channel is spending without producing customers? Fix it or cut it.
- Does anything disagree? If the ad platform claims more leads than your CRM recorded, that's a tracking problem to chase before you trust either number. Our guide to marketing attribution explains why every platform tends to claim the same sale.

Write down what you decided. Next month, check whether it worked. That loop is the whole point. The dashboard isn't the goal. Better decisions about where the next dollar goes are.
Where to Start This Week
Don't try to build the perfect dashboard. Do two things this week. First, check that your website leads and phone calls are actually being recorded by source. Second, open a blank sheet and fill in last month's leads, customers and spend for each channel by hand. If that takes you an hour, you've just proven why it's worth automating.
Want to see how we handle the data side for clients? The work we've done is a good place to start.
Frequently Asked Questions
Want one dashboard that shows what's working?
Book a free 30-minute call. We'll look at where your leads, spend and sales live today, tell you straight what's missing, and sketch the dashboard that would answer your questions.
Book a Free Analytics Call